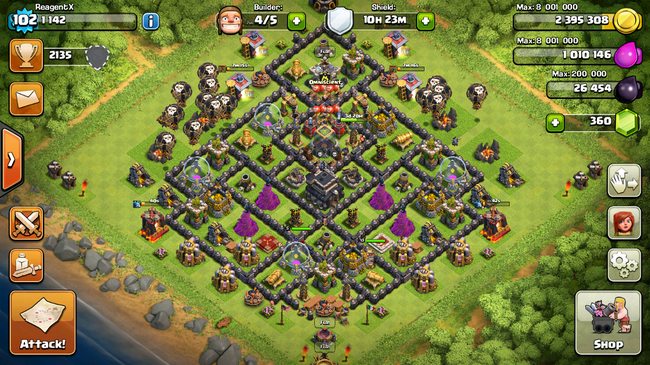
 My humble village.
Or: How I made the CoCulator.
 My humble village.
Clash of Clans has been a little obsession of mine over the last few years. The economy of this game always fascinated me, and I have finally found the time to analyze it. I will be providing the raw data and Excel workbooks for your entertainment throughout this post.
The number one question I had before I began this project was what a fully maxed Town Hall 10 base would cost if one were to upgrade using only gems, i.e. the nominal value of a Clash of Clans base. This chart shows the cost to upgrade to the base level from the max of the previous base level:
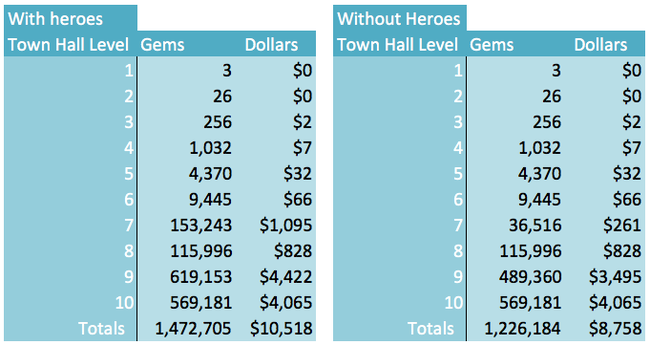
With heroes, the growth rate becomes negative from Town Hall 9 to Town Hall 10. Without, it only slightly drops. This is because the cost addition of the Archer Queen at Town Hall 9 is so large: at Town Hall 9, the Queen can be upgraded from level 1 all the way to level 30, cumulatively costing 2,397,500 Dark Elixir. The cumulative cost from 31–40 is only 1,775,000. Thus, calculating them separately yields a slightly smoother curve:
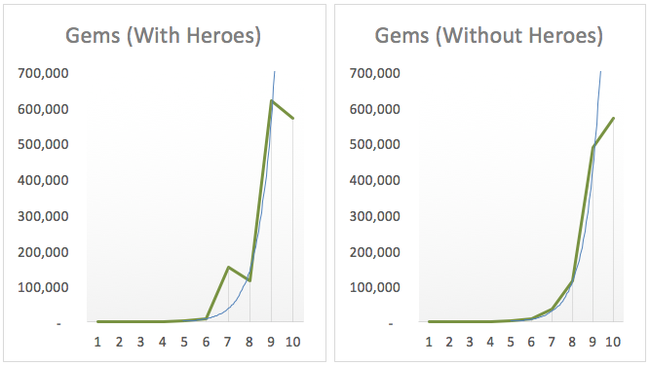 Green line is actual data, blue line tracks the Pareto curve trend.
The distribution we see is a example of a Pareto distribution: in this case, just over 80% of the upgrade cost falls under the last two Town Hall levels. You can view this data in this Google Sheet. However, the charts aren’t as pretty.
The buildings each have a respective cost that change quite a bit over time. I exported images of the chart below from the worksheet and compiled them as a gif. Note the changes to scale:

From Town Hall 1 to Town Hall 10. See .mp4 version here. Units: gold/elixir.
Troops have a similar pattern, with the costs exponentially rising through the course of the game. Below are the charts for standard light and dark troops.
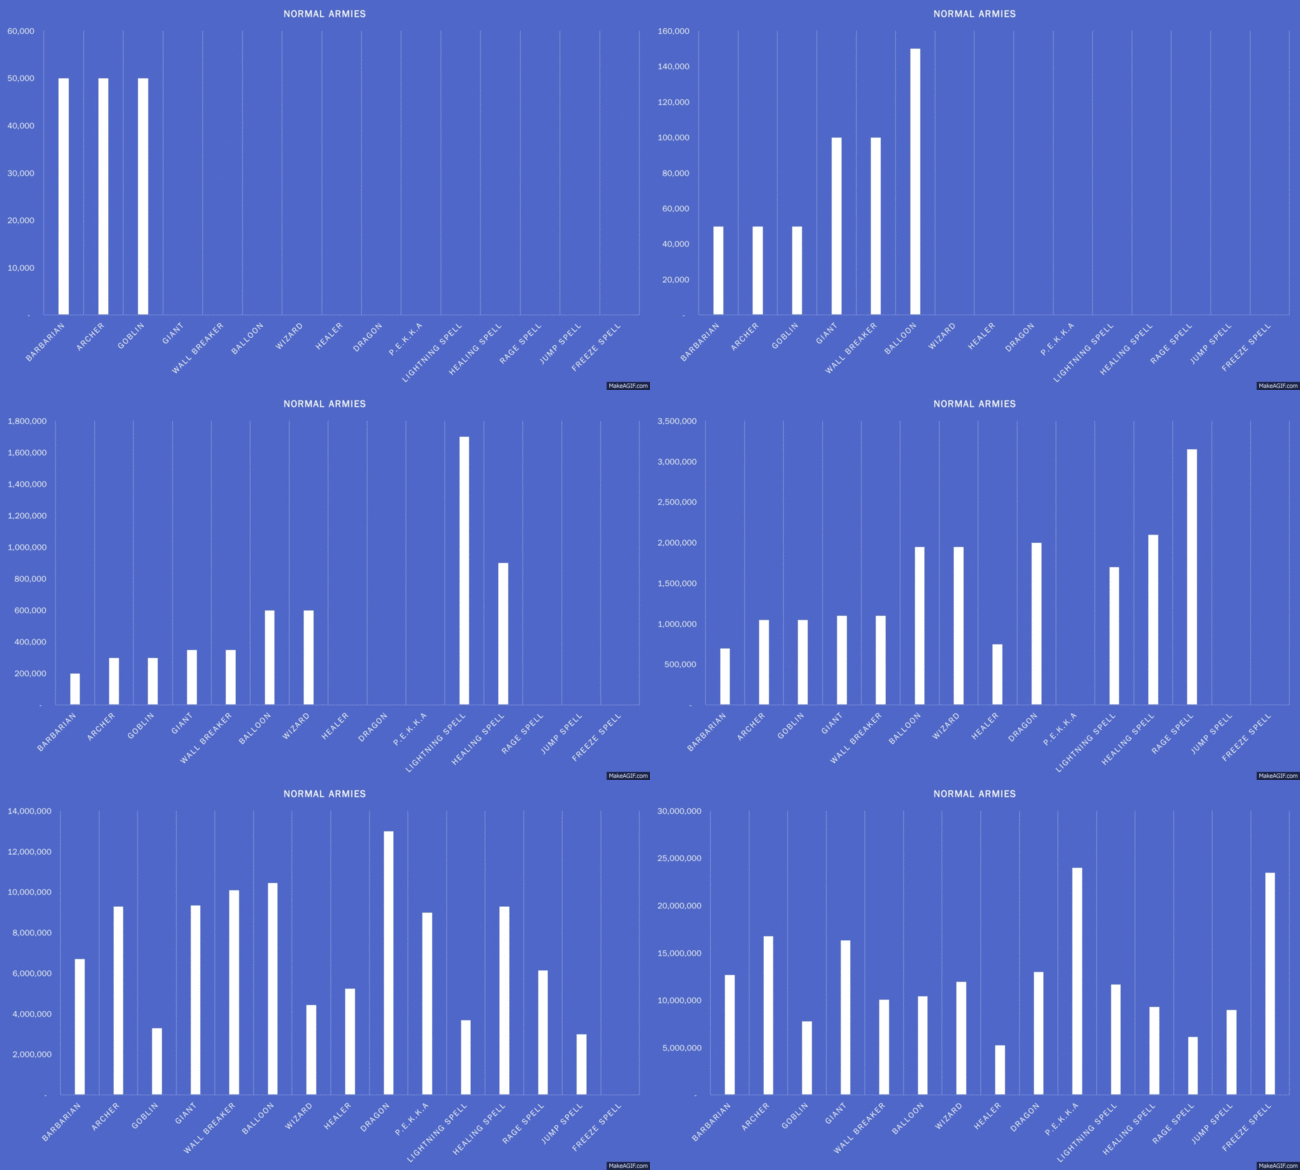 Troop upgrades start at Town Hall 3, not Town Hall 1. .mp4 available here. Units: elixir.
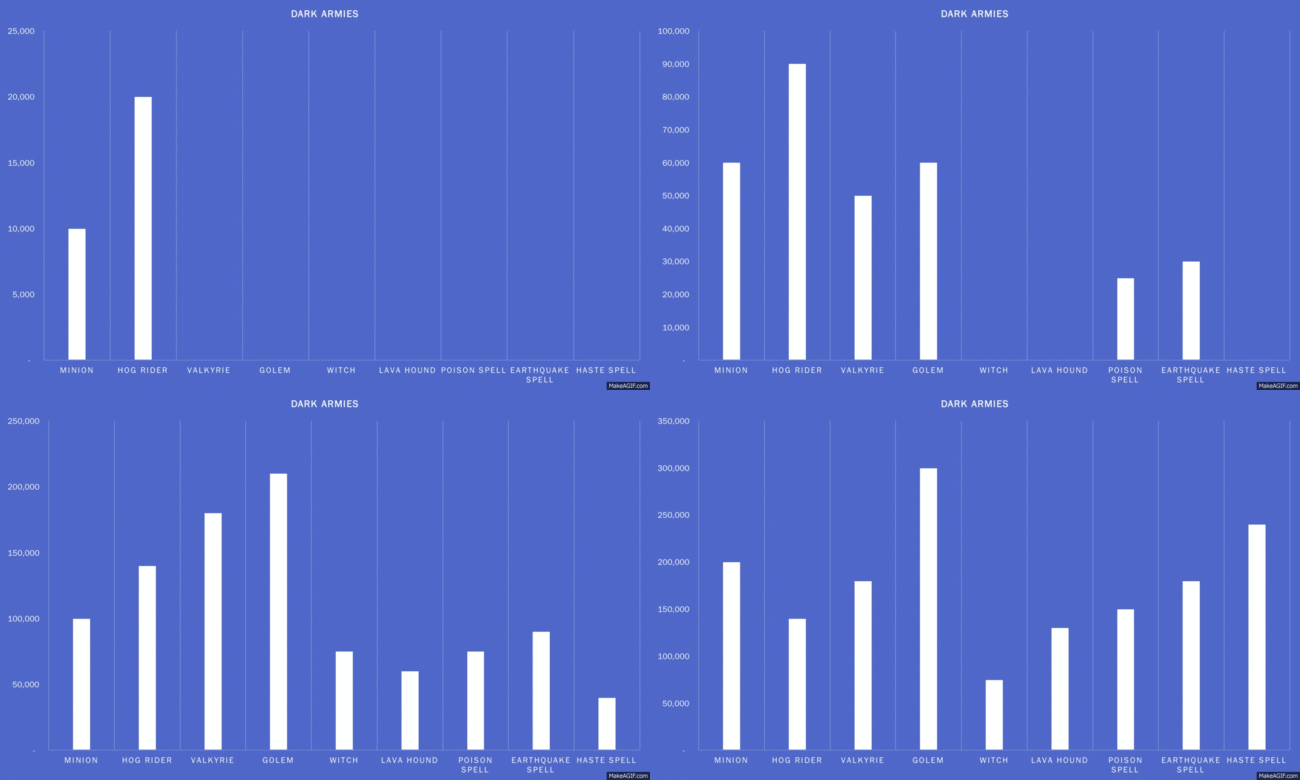 Dark troop upgrades start at Town Hall 7, not Town Hall 1. .mp4 available here. Units: dark elixir.
The graph for Heroes does not show very much progression, as there are only 2 types and most of the upgrades are in the later levels. Here is the final chart for Town Hall 10 Heroes:
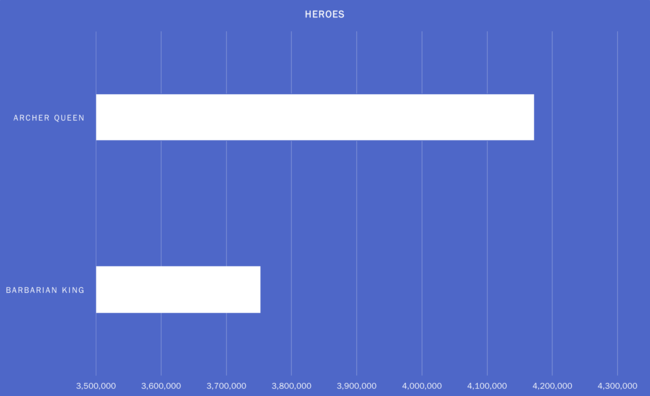 Units: Units: dark elixir.
As you can see, the Queen far outpaces the King.
The real reason for this post was my curiosity of what it would take me to fully upgrade my base. My spreadsheet can do this quite easily. Once I enter the data to the respective places (outlined below) the worksheet will give you your data. Here’s how mine looked:
 Cost progression with columns U to AG hidden.
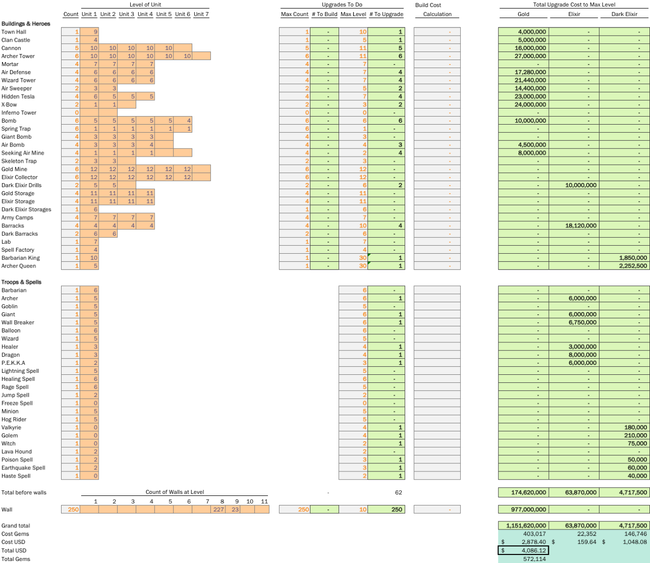 Cost progression summary with columns B to AF hidden.
As you can see, it would cost me 572k gems or $4,086 to fully upgrade my base to Town Hall 9.
All calculations are completed using this spreadsheet. It is also hosted in this Google Sheet. The Google Sheet will do the math but cannot render the charts as far as I can tell.
Happy CoCulating!
To make things as clear as possible, I want to explain my methods and document how my methods work for those who may wish to expand this research and manipulate the data. I also document the assumptions I’ve made to simplify some of the more complicated facets of this project.
All of the data I used came from the charts on the Clash of Clans Wiki. Each troop/building/spell has a small chart that I used to import into a large worksheet. Huge thanks to all of the hardworking people who contribute to the Wiki!
 Screenshot from http://clashofclans.wikia.com/wiki/Haste_Spell
You can download the Excel worksheet here or view it in Google Sheets here. I will be using this data source to make all of the calculations in the rest of the project. For this analysis, I only used the columns pertaining to the level, cost, and requirement columns. However, all of the data is in the table if you want to do your own experimentation.
The calculations assume that no wait times are expedited: only the cost of resources are calculated. I made this choice because buying resources is more efficient than buying time.
Gem cost is located in this Google Sheet and calculated as follows:

When calculating the dollar cost, I assume purchasing of the 14,000 gem pack. I made this assumption because it is the cheapest option when buying lots of gems. Is it less realistic? Perhaps. It is, however, the most efficient in the long run.
Calculations assume that you are upgrading to the maximum of your base’s capacity: if you enter “7” for your Town Hall level, it will calculate the costs to max all of your buildings to the Town Hall 7 limits. Thus, if you enter 1, it will calculate all the costs associated with maxing a level 1 Town Hall. Enter a higher level to calculate for a higher Town Hall. If you are level 6, entering 7 will calculate the cost to get from your current setup to a max level 7.
Calculations are made only to max the levels of buildings: there are no partial calculations.
Resources are assumed to have been bought directly from the building dialog itself, bypassing your collectors.
Currency is USD. This can be easily changed in the Gem Cost Assumptions tab.
No builder’s huts are purchased. Since we do not account for time, they are irrelevant. Time is infinite, resources are finite.
Resources from your collectors are not used. Upgrading your collectors last using the all-gems method will make the amount of resources they generate a rounding error.
Gems start at zero. You actually start at 500 and the game forces you to spend some, but I ignored this. By the time you get to the final Town Hall 10 count, 500 gems would be a rounding error anyway.
Walls are upgraded with gold, not elixir, from level 8 onward. This doesn’t actually matter for the cost calculations (gold and elixir cost the same), but does mean some of the cost that can be split between the two resources is not displayed that way in my spreadsheet.
This began as a project to calculate the upgrade cost (in gems and dollars) to max out my base. Thus, I needed to be able to input the current building data for my base.
 Organizational structure of the data-entering system.
I created a column-based system to enter the level of each building: each row has a different building, followed by 7 columns used to enter the level of each building. It may take some time to get everything entered properly, but this is the simplest way to make the relevant calculations.
I found the easiest way to do this was to put my village into edit mode, remove all of the pieces, and use the list of structures to enter the data into the fields.
All calculations are done in this spreadsheet. It is also hosted in this Google Sheet, but some formulas and charts are not supported.
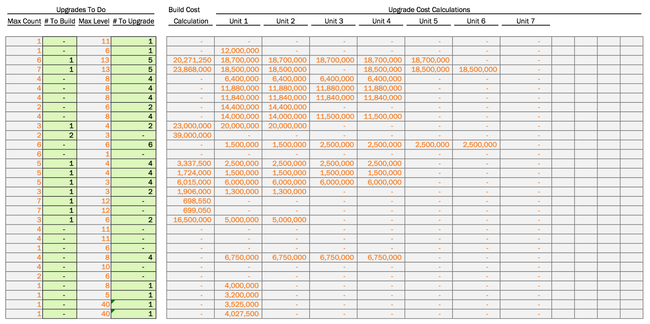
Each row corresponds to a row from the above data-entering system. Extra rows added in case additional buildings are added. Generally all columns except for “Calculation” are hidden.
Finally, the fun part! There are many different calculations that go into this worksheet. Foremost, we must get the data from the correct column for the Town Hall level:
=IF(OR(ISNUMBER(B10,$Q10=B10),IFERROR(SUM(OFFSET(Tables!$A$75,MATCH($A10,Tables!$A$75:$A$106,0)-1,1,1,$Q10)),0),0)*P10Then, we must calculate the cost of each individual building (up to 7 buildings):
=IF(OR(ISNUMBER(C10),$Q10=C10),IFERROR(SUM(OFFSET(Tables!$A$75,MATCH($A10,Tables!$A$75:$A$106,0)-1,C10+1,1,$Q10-C10)),0),0)Once all of the individual building upgrade costs have been calculated, they are summed and pushed into charts. All of the calculations from this point are basic sums or other simple arithmetic.
Now go forth with your newfound knowledge and Clash On!
This post will be updated when the stats for the recently announced Town Hall 11 (and it’s respective buildings) are released.
Discussion: r/ClashOfClans